
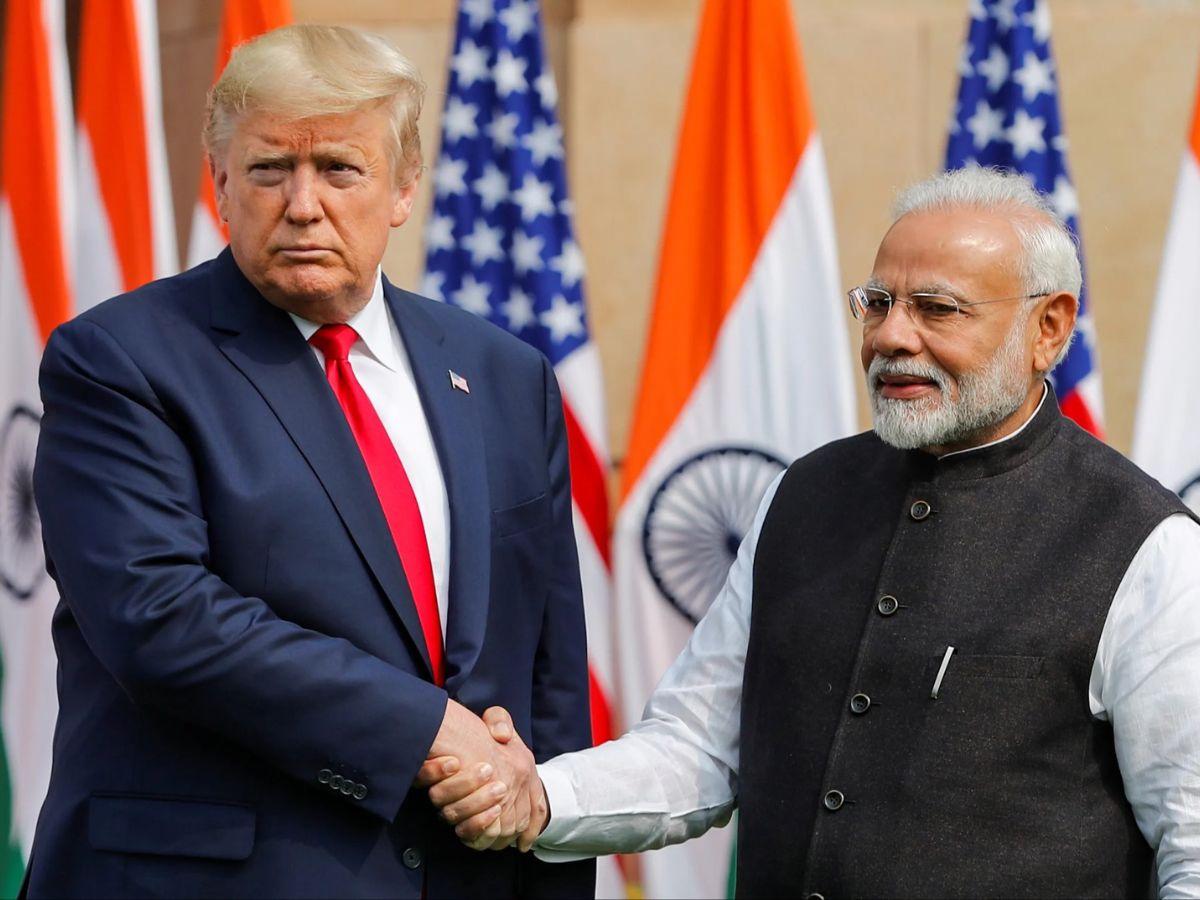
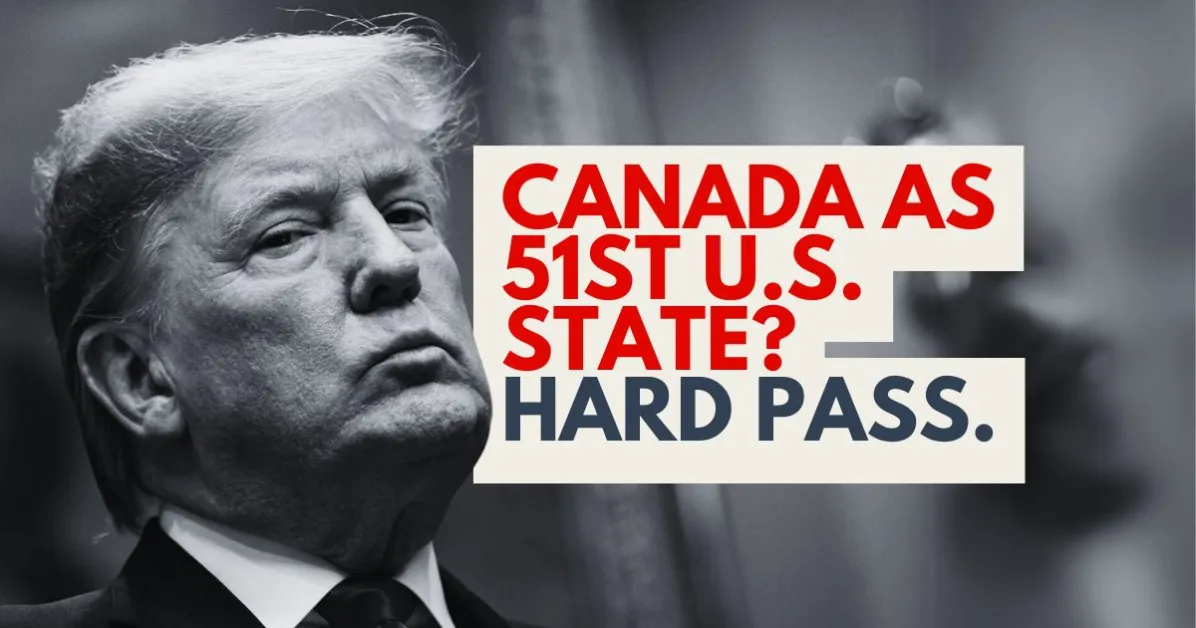
- Trump keeps Canada, Mexico (and the markets) on the edge
- Zelensky bends the knee…will there be peace finally ?
- Can US become the crypto capital of the world ?
- Will this bottom hold or is it just a pause again ?
Global Markets
YTD Performance
Looks like money has moved out of US as well and now into China !

3-Macros
$₹ / Gold / Oil
We look at the 3 Macros that affect Indian market viz., $₹ / Gold / Oil

USD/₹ : rupee remains weak as along as above 50dma
Gold : retest, pulled into 50dma and may go into new high zone
Oil : weak, living below the 10wma
Marketcaps
Perf Charts
We compare YTD vs 3M returns to check where the money is flowing
YTD Basis : Nifty, Cnx500, Midcaps
3M Basis : Nifty, Cnx500, Midcaps

Micro-caps are on the move now and the 3M RSI is now above 60 for the first time after 4-Feb showing growing momentum.
The Market
CNX500
The fib618 support held for the 3rd time as well…as of this week.
Still not a time to get aggressive till market breadth improves but testing the water would not be a bad idea with leading names in leading sectors.

Nothing good happens below the 200dma.
Market Breadth
New Highs / New Lows
We are still below the zero line……no choice but to wait patiently for market breadth to improve

Sectoral Analysis
Performance and RS
We compare YTD-RS vs 3M-RS to check sector rotation in market
YTD Basis : Metals, Commodities, Finance
3M Basis : Metals, Pvtbanks, Finance

Industry Groups
Leadership / Strength

Commodities Outlook
Perf Chart
We compare YTD vs 3M to check which Commodities are on the move
YTD Basis : Naturalgas, Copper, Gold
3M Basis : Naturalgas, Gold, Aluminium

Crypto Outlook
Perf Chart
We compare YTD vs 3M to check which Crypto is outperforming the custom index?
YTD Basis : USDC, XRP, TRX
3M Basis : USDC, XRP, BTC

Ai (active investing)
Trade Plan
Testing the water….
Jindalstel
Weekly Chart

Chambal Fertilizers
Weekly Chart

SRF
Weekly Chart

Hindalco
Weekly Chart


Leave a Reply